I found an interesting site today – visualcomplexity.com. It contains several hundred visual representations of complex information.
Visit Visual Complexity
“VisualComplexity.com intends to be a unified resource space for anyone interested in the visualization of complex networks. The project’s main goal is to leverage a critical understanding of different visualization methods, across a series of disciplines, as diverse as Biology, Social Networks or the World Wide Web. I truly hope this space can inspire, motivate and enlighten any person doing research on this field.” (from Visual Complexity’s About page)
On the site, I found a link to the Institute for Nanoscale Science & Technology, MediaLabMadrid, Protein Design Group’s web site. The image below is a circular approach – the first graphical representation (oracle) of the network of interactions; It represents each gene with colored segments associated to the structural description of the gene’s main function. The color of the relation curves expresses the nature of relation, and the traces external to the circle establish a relation of auto regulation (Ortiz et. al., 2005).
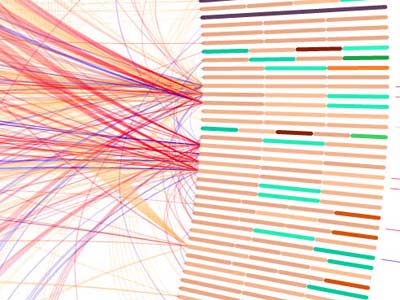
Visit Institute for Nanoscale Science & Technology, MediaLabMadrid, Protein Design Group
The materials shown in this post are copyright protected by their authors and/or respective institutions.
![Postcard collection from Expo 67 [repost]](https://www.joehallock.com/wp-images/2017/07/expo67_077.jpg)
Leave A Comment