HOME  >  DATASETS
1. HOME 6. PSYCHOLOGY
2. EDUCATION 8. ONLINE ACTIVITIES
3. METHODS 8. CONCLUSION
4. ASSOCIATIONS 9. DATA SETS
5. PREFERENCES 10. CREDITS
 
Data sets

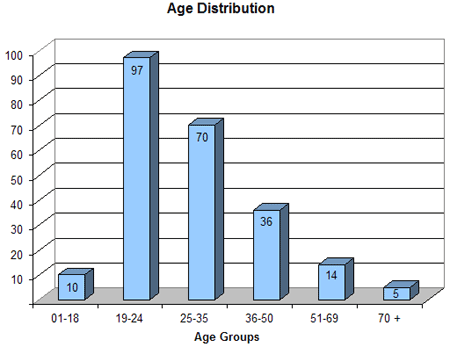
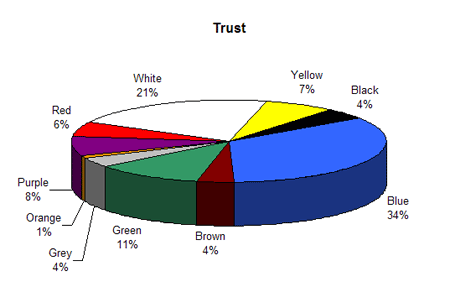
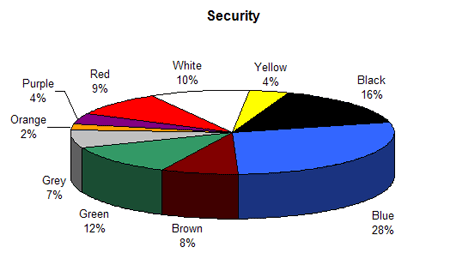
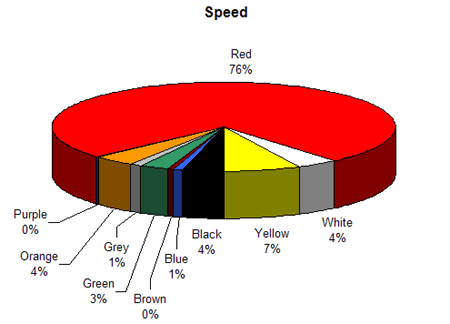
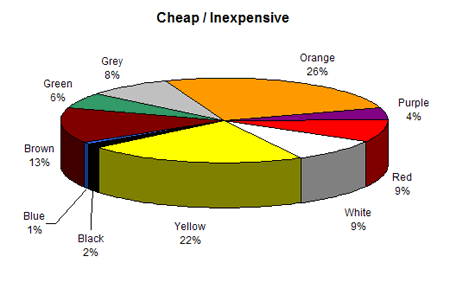
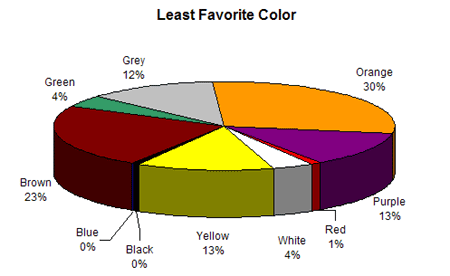
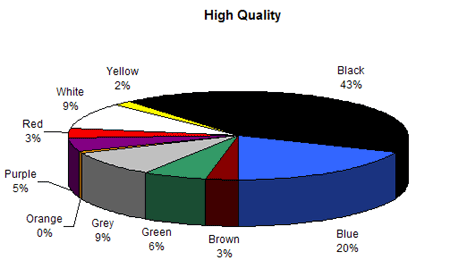
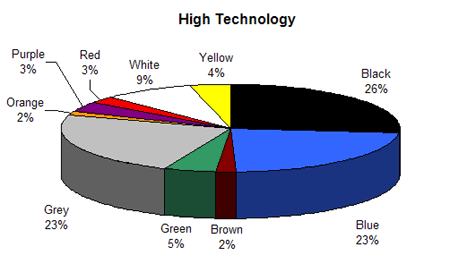
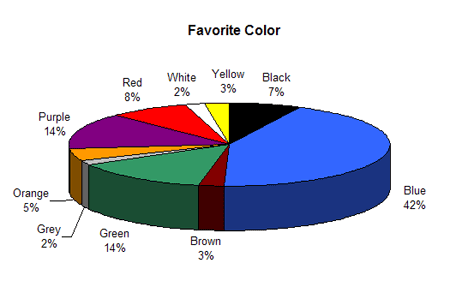
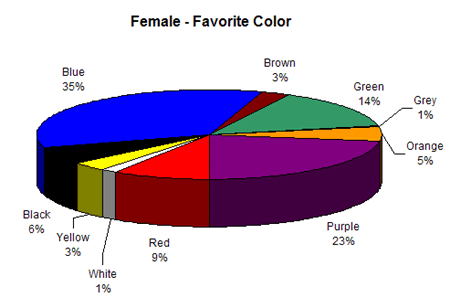
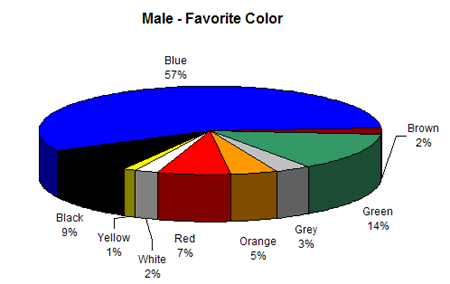
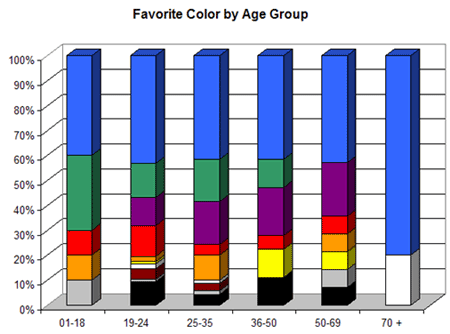
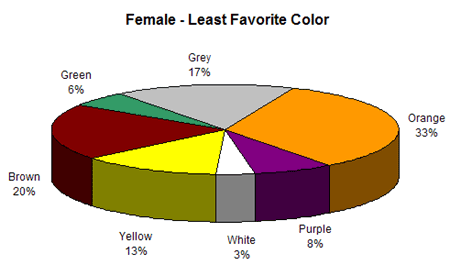
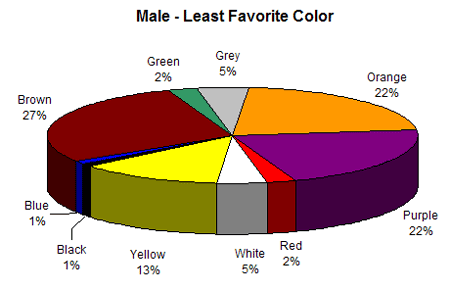
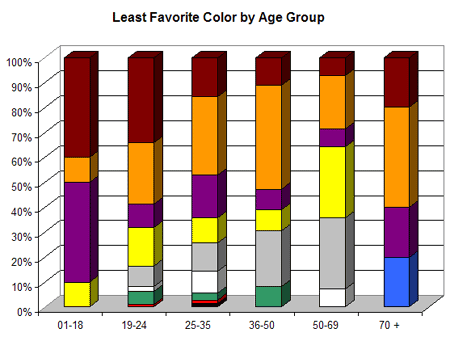
This section provides the data gathered during the survey, the graphs used during the analysis, and the histograms used to present the participants importance of the selected online activities. The data-table (containing all the result data from the survey) and the histograms are located on separate pages and the graphs are listed below in order that they were presented during the essay.

Graphs
Histograms
Data Table (Opening this link will open up a large html file ~ 400 Kb)


Graphs


Figure 3.1 - Age Groups


Figure 4.1 - Association with Trust


Figure 4.2 - Association with Security


Figure 4.3
- Association with Speed


Figure 4.4 - Association with Cheap / Inexpensive


Figure 4.5 - Least Favorite Color


Figure 4.6 - Association with High Quality


Figure 4.7 - Association with High Technology


Figure 4.8 - Association with Reliability / Dependability


Figure 4.9 - Association with Courage / Bravery


Figure 5.0 - Association with Fear / Terror


Figure 5.1 - Association with Fun


Figure 6.1 - Favorite Color


Figure 6.2 - Female Favorite Color


Figure 6.3
- Male Favorite Color


Figure 6.4 - Favorite Color by Age Group


Figure 6.6 - Female - Least Favorite Color


Figure 6.7 - Male - Least Favorite Color

Figure 6.9 - Least Favorite Color by Age Group


PREVIOUS  |  NEXT >